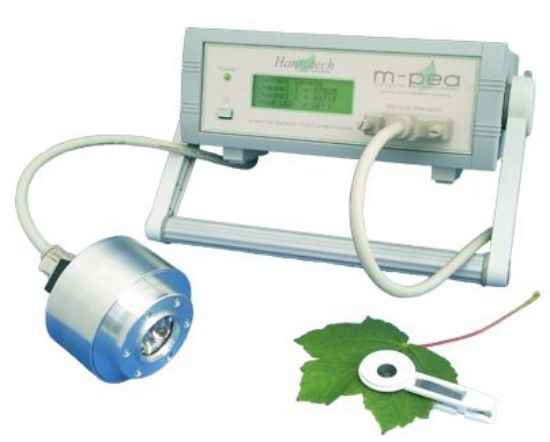
MPEA-1 Multifunction fluorescence system_1201442
Representative image only

MPEA-1 Multifunction fluorescence system

Overview

Multi Function Plant Efficiency Analyser

  • Advanced lab-based system for investigation of plant photosynthetic efficiency
  • M-PEA-1 variant for prompt fluorescence & P700+ modulated absorbance measurements
  • M-PEA-2 variant as M-PEA-1 with additional measurements of Delayed Fluorescence (DF) & leaf absorptivity
  • Sophisticated sensor unit with all optical emitters & detectors in a robust, enclosed housing
  • USB connection to a Windows® PC
  • Comprehensive Windows® experimental design, data transfer & analysis software

The M-PEA (Multi-Function Plant Efficiency Analyser) combines high quality fast fluorescence kinetic and P700+ absorbance studies with ground-breaking Delayed Fluorescence (DF) measurements providing one of the most comprehensive systems for the investigation of plant photosynthetic efficiency available.

The M-PEA is a laboratory-based measurement system consisting of a control unit and sophisticated, robust sensor unit housing all optical emitters and detectors for all measurement elements.

The system is controlled from a comprehensive Windows® software package (M-PEA+) which allows complex experiments to be designed, uploaded and executed by the M-PEA hardware. Recorded data is quickly downloaded to the software via a USB2.0 connection.

The control unit is of convenient size with minimal footprint allowing measurements to be made in a busy lab environment where bench space is critical. The front panel consists of a power switch and indicator LED, optical sensor connection and a 4 line LCD display. The rear panel provides input for a 12V DC power supply and a USB2.0 connection socket for interface to the M-PEA+ software running on a Windows® PC.

M-PEA Optical Sensor

The optical sensor unit is a robust enclosure designed to incorporate sophisticated electronics which effectively controls all of the light sources and detectors. The M-PEA-1 sensor unit includes a high intensity red actinic source, a far-red light source, the prompt fluorescence detector and the modulated emitter/detector pair for P700+ absorbance measurements. M-PEA-2 additionally includes a high sensitivity delayed fluorescence detector and a detector to measure leaf absorptivity.

All the optics are located behind a quartz window which seals the sensor unit providing effective protection for the optical assemblies against dust, dirt and moisture.

M-PEA+ Software

M-PEA Plus is a custom Windows® software package created for experimental design and deployment and comprehensive analysis of recorded data.

M-PEA Plus consists of 2 main elements:

M-PEA Plus Protocol Editor

The protocol editor allows the creation of experiments for deployment on the M-PEA system. Experiments can range in complexity from a simple 1 second prompt fluorescence measurement through to repeating, multi-flash measurements using prompt and delayed fluorescence, P700+ and relative absorptivity to probe the activity of PSI and PSII complexes within the photosynthetic apparatus.

Data Analysis Modules

Once recorded data is downloaded into M-PEA Plus software from the control unit, a series of tabs are displayed within the main interface; each of which plots the downloaded data in a different way. These tools consist of a variety of graphical and numerical data display methods including line graph of recorded data, rank plot, radar plot and full tabulated data.

Common Parameters Measured

Fo

Parameters Measured by Hansatech Instruments Continuous Excitation Chlorophyll Fluorescence Systems

The Fo parameter is thought to represent emission by excited chlorophyll a molecules in the antennae structure of Photosystem II. The true Fo level is only observed when the first stable electron acceptor of Photosystem II called Qa is fully oxidised. This requires thorough dark adaptation. Fo occurs at time base 0. It is the almost instantaneous (nanoseconds range) rise to an origin level of chlorophyll fluorescence upon illumination using a chlorophyll fluorimeter. Due to restrictions in electronics technology and the speed of fluorescence detection, it is not possible to measure the true Fo. However, it is possible to estimate the Fo level to a high degree of accuracy using a mathematical algorithm.

Fm

This is the maximum chlorophyll fluorescence value obtained for a continuous light intensity. This parameter may only be termed as maximum fluorescence if the light intensity provided by the chlorophyll fluorimeter is fully saturating for the plant and the electron acceptor Qa is fully reduced. If the light intensity used for the recording is not sufficiently high, the plant may not be fully saturated in all circumstances. The peak fluorescence level (Fp) achieved in these circumstances would not be maximal and therefore should not be used as Fm. Consequently the ratio Fv/Fm would not be correct and the ratio would strictly be Fv/Fp with a reduced value. This was commonly the case when using an older chlorophyll fluorimeter with a lower maximum light intensity for excitation due to constraints in technology. Rapid advances in LED technology allow modern day analytical instrumentation to be designed to incorporate ultra-bright LED’s providing fully saturating light intensities in smaller, more manageable units such as the Handy PEA, Pocket PEA and M-PEA fluorimeters.

Fv

The Fv parameter indicates the variable component of the recording and relates to the maximum capacity for photochemical quenching. It is calculated by subtracting the Fo value from the Fm value.

Fv/Fm

Fv/Fm is a parameter widely used to indicate the maximum quantum efficiency of Photosystem II. This parameter is widely considered to be a sensitive indication of plant photosynthetic performance with healthy samples typically achieving a maximum Fv/Fm value of approx. 0.85. Values lower than this will be observed if a sample has been exposed to some type of biotic or abiotic stress factor which has reduced the capacity for photochemical quenching of energy within PSII. Fv/Fm is presented as a ratio of variable fluorescence (Fv) over the maximum fluorescence value (Fm).

Tfm

Tfm is a parameter used to indicate the time at which the maximum fluorescence value (Fm) was reached. This parameter may be used to indicate sample stress which causes the Fm to be reached much earlier than expected.

Area

The area above the fluorescence curve between Fo and Fm is proportional to the pool size of the electron acceptors Qa on the reducing side of Photosystem II. If electron transfer from the reaction centres to the quinone pool is blocked such as is the mode of action of the photosynthetically active herbicide DCMU, this area will be dramatically reduced.

The Area measurement is a very useful parameter as it highlights any change in the shape of the induction kinetic between Fo and Fm which would not be evident from the other parameters e.g. Fo, Fm, Fv/Fm which only express changes of amplitude of the extreme Fo and Fm. An example of its use would be following the time dependence of herbicide penetration into the leaf by following changes in the induction kinetic with time.

Time Marks Parameters

The PEA Plus and M-PEA Plus software packages extract chlorophyll fluorescence values from the recorded data from Handy PEA, Pocket PEA and M-PEA chlorophyll fluorimeters at 5 pre-defined Time Marks. The times are:

  • T1 = 50 microseconds
  • T2 = 100 microseconds
  • T3 = (K step) 300 microseconds
  • T4 = (J step) 2 milliseconds
  • T5 = (I step) 30 milliseconds

Chlorophyll fluorescence values at these Time Marks are used to derive a series of further biophysical parameters, all referring to time base 0 (onset of fluorescence induction), that quantify the photosystem II behaviour for (A) The specific energy fluxes (per reaction centre) for:

  • Absorption ()
  • Trapping ()
  • Dissipation ()
  • Electron transport ()

and (B) the flux ratios or yields:

  • Maximum yield of primary photochemistry ()
  • Efficiency () with which a trapped exciton can move an electron into the electron transport chain further than QA-
  • Quantum yield of electron transport ()

The concentration of active PSII reaction centres per excited cross section () is also calculated.

Performance Index Parameters (OJIP Analysis)

The Performance Index is essentially an indicator of sample vitality. It is an overall expression indicating a kind of internal force of the sample to resist constraints from outside. It is a Force in the same way that redox potential in a mixture of redox couples is a force. Exactly the PI is a force if used on log scale. Therefore we say:

The PI or Performance Index is derived according to the Nernst equation. It is the equation which describes the forces of redox reactions and generally movements of Gibbs free Energy in biochemical systems. Such a force (or potential = force) is defined as:-

where x is the fraction of a partner in the reaction A to B. Therefore:

and if you now convert to:

or for redox reactions

Now the total potential in a mixture is the sum of the individual potentials or:

….etc

In our case PI (on an absorption basis or on a chlorophyll basis) has three components:

The first component shows the force due to the concentration of active reaction centers

therefore:

RC/ABS is a parameter of the JIP test and it is related to the force generated by the RC concentration per antenna chlorophyll.

The second component is the force of the light reactions, which is related to the quantum yield of primary photochemistry:

The Driving force of the light reactions is therefore:

The third component is the force related to the dark reactions (after Qa-). These are normal redox reactions in the dark.Expressed by the JIP-test as:

Where = relative variable fluorescence at 2 ms or at the step J therefore:

Therefore the force of the dark reactions is:

Now all three components together make:

or without log

or in fluorescence terms:

A more detailed derivation and explanation is beyond the scope and intention of this web page. Further detailed information may be obtained from the following publications which may be downloaded as PDF documents from the following links.

R.J. Strasser, A. Srivastava and M. Tsimilli-Michael The fluorescence transient as a tool to characterize and screen photosynthetic samples.

Strasser, R.J., M. Tsimilli-Michael and Srivastava, A. Analysis of the Fluorescence Transient.

Modulated P700+ Absorbance Measurements

Hansatech Instruments M-PEA Modulated P700+ Absorbance Measurements

The photosynthetic electron transport chain consists of 3 large protein complexes Photosystem II (PSII), Cytochrome (cyt b6/f), Photosystem I (PSI). P700 is the term used to describe the chlorophyll within the reaction center of PSI as this is the wavelength of light to which the photosystem is most reactive. Upon illumination using a strong light source, the photosynthetic electron transport chain is almost entirely reduced.

The electrons from this reduction in turn activate the enzyme ferredoxin-NADP+ reductase which leads eventually to NADP reduction and CO2 fixation. This initial reduction process is represented by the O-J-I-P steps of the Kautsky induction curve during prompt fluorescence measurements.

The oxidation of P700 causes an increase in absorbance at wavelengths falling in the 800 – 850nm band. M-PEA measures the transmission of P700 using a modulated LED with a peak wavelength of 820nm and a highly sensitive photodiode to monitor the absorbance of the PSI complex during prompt fluorescence measurements.

Since the 820nm LED is not actinic, M-PEA is able to use high light intensities without disturbing the PSII complex. Therefore, M-PEA presents a convenient, reliable method of measuring chlorophyll a fluorescence and transmission at 820nm simultaneously, thus allowing the study of the electron transport process during the Kautsky induction at both end of the photosynthetic electron transport system.

M-PEA is also fitted with a far-red light source which can be used to preferentially excite the PSI complex. Re-reduction occurs via the intersystem electron transport chain by PSII activity, with electrons originating from hydrolysis.

The M-PEA uses an optically filtered, modulated 820nm LED for high quality P700+ absorbance measurements. P700+ activity is recorded using an optimised low noise, fast response PIN photodiode and 16 bit A/D converter providing an excellent signal-to noise ratio. Measurements of prompt fluorescence and P700+ are plotted on the same axes in the M-PEA+ software.

Delayed Fluorescence Measurements

Hansatech Instruments M-PEA Delayed Fluorescence Measurements

Like PF, the properties of the DF emission are highly sensitive to the functional state of Photosystem II and the photosynthetic reaction chain as a whole. Theoretically, DF bears even more information about the photosynthetic processes than PF. Still, a fluorescence measuring instrument can be found in almost every plant science research laboratory, while DF has not gained much popularity as a practical method to study the photosynthetic organisms. One reason for such injustice is that DF is harder to register than PF. But the greatest difficulty in using DF is its interpretation, or extracting the valuable information from this extremely complex signal.Delayed fluorescence (DF) has much in common with prompt fluorescence (PF) because it originates from the same chlorophyll molecules of the Photosystem II antenna complexes. DF is essentially light that is emitted from green plants, algae and photosynthesising bacteria for a short time after they have been exposed to light, but after the prompt fluorescence emission has decayed. Delayed fluorescence occurs in the red-infra-red region of the spectrum (the same as prompt chlorophyll fluorescence). However, the intensity of the delayed fluorescence emission is lower than that of prompt fluorescence by at least two orders of magnitude therefore requiring extremely high sensitivity apparatus to measure the signal.

Fortunately, in recent years we’ve witnessed major advances both in development of electronic engineering and also in the theory of DF measurements. We are more and more able to utilise DF for practical scientific research. It is the combination of these 2 factors that has lead to the development of M-PEA.

The delayed fluorescence emission, natural to all green plants, has been known to scientists for over fifty years. It was first discovered by Strehler and Arnold (1951) when they were attempting to use the firefly luminescence for the measurement of the light-induced accumulation of ATP in the green alga Chlorella. They found that even without the addition of luciferase and luciferin, there was a long-lived glow from algal cells and chloroplasts in darkness following illumination. The observed delayed fluorescence was characteristic of different photosynthesising samples used—leaves (Strehler and Arnold 1951), chloroplasts and photosynthesising bacteria (Arnold and Thompson 1956). Strehler and Arnold postulated that it was in fact chemiluminescence of the chlorophyll, caused by reversal of the photosynthetic reactions. The close relationship between DF and the photosynthetic reactions was confirmed undoubtedly in many studies and sometimes DF was found even more sensitive than the prompt fluorescence (Kramer and Crofts, 1996).

M-PEA Variant Feature Comparison

M-PEA-1

Signals measured

  •  Delayed fluoresence
  •  Relative absorptivity

M-PEA-2

Signals measured

  •  Prompt fluorescence
  •  P700+ absorbance
  •  Delayed fluoresence
  •  Relative absorptivity

Over 40,000 Customers Trust John Morris